When predicting this year’s Best Picture Oscar for your annual office pool—not that we condone gambling—bear in mind the following caveat: the box office is no Oscar psychic!
One of many Oscar myths says that Academy members only nominate the year’s chief breadwinners for Best Picture, choosing the most lucrative among those to take home Oscar bling. History dispels this myth, however, since past winners’ earnings are all over the place, instead of only high. Furthermore, if it were true, then where amongst this year’s noms is Kong? Potter? Narnia? Sith?
Busting this myth doesn’t mean that the mega-blockbusters don’t get love (The Lord of the Rings: The Return of the King of ’03, anyone?), but there appears to be more of a healthy fluctuation than is commonly suspected. This year’s winner will really do a number on the numbers, since none of the nominees will have even eclipsed the $100 million (Oscar) gold standard. In fact, Brokeback Mountain, an indie in spirit and ambition, is the closest of the nominees to that mark, with just over $75 million* in the bank. Furthermore, last year’s winner, Million Dollar Baby, just eked out 100 mil.
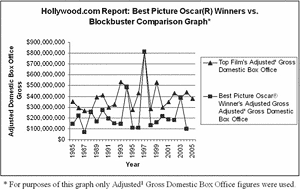
As we round the corner for this year’s ceremony (Sunday, March 5), a glimpse into the Oscars’ recent history reveals interesting tidbits about the Best Picture category, some of which may help foretell this year’s outcome. After adjusting box office figures to reflect today’s ticket prices, we looked at the past 20 years to compare each year’s Best Picture winner to that year’s highest grossing movie.
Here’s what we found: after box-office adjustments were made, all but one Best Picture winner (1987’s Last Emperor) grossed at least $100 million; on four occasions (20 percent), the Best Picture winner was also the year’s highest grossing film; the average updated box office gross of Best Picture winners was approximately $224 million, while the average updated box office gross of the highest grossing film from each year (including 2005) was approximately $391 million. In addition, on just five occasions (25 percent) was the year’s highest grosser even nominated. What sense is to be made of all of this? While Best Picture winners are almost certain to rake in the dough, they pale in comparison to the money made on the true blockbusters of years past. Which spawns a whole box office-versus-quality debate, but, darn it, this is box office-versus-Oscars! Speaking of which—Happy Oscars.
Below is the list of Best Picture winners as compared to each year’s highest grossing film, with each film’s box office gross (pre-2004) updated:
*as of Feb. 26
| Year |
Best Picture Oscar® Winner, Gross Box Office / Adjusted¹ Gross Domestic Box Office
|
| 2005 |
?
|
| 2004 |
Million Dollar Baby
$100,422,786 / $100,422,786 |
| 2003 |
Lord of the Rings: The Return of the King
$376,853,002 / $388,102,345 |
| 2002 |
Chicago
- Advertisement -
$170,684,505 / $182,435,589 |
| 2001 |
A Beautiful Mind
$170,708,996 / $187,297,326 |
| 2000 |
Gladiator
$187,670,866 / $216,221,906 |
| 1999 |
American Beauty
$130,058,047 / $158,988,281 |
| 1998 |
Shakespeare in Love
$100,241,342 / $132,728,914 |
| 1997 |
Titanic
$600,743,440 / $812,770,536 |
| 1996 |
The English Patient
- Advertisement -
$78,651,430 / $110,503,479 |
| 1995 |
Braveheart
$75,545,647 / $107,847,923 |
| 1994 |
Forrest Gump
$329,168,011 / $489,027,116 |
| 1993 |
Schindler’s List
$96,045,248 / $144,067,872 |
| 1992 |
Unforgiven
$100,003,672 / $149,644,048 |
| 1991 |
The Silence of the Lambs
$130,650,794 / $192,717,679 |
| 1990 |
Dances with Wolves
$184,010,809 / $270,143,528 |
| 1989 |
Driving Miss Daisy
$105,584,081 / $165,153,277 |
| 1988 |
Rain Man
$171,188,895 / $258,657,673 |
| 1987 |
The Last Emperor
$43,020,223 / $68,326,236 |
| 1986 |
Platoon
$131,755,562 / $220,539,633 |
| 1985 |
Out of Africa
$83,142,343 / $145,440,5 |
1Adjusted Gross Domestic Box Office figures are derived based on the total domestic gross of the film, divided by average ticket price in the year of release, multiplied by 2004 average ticket price ($6.21). Average annual ticket prices source: MPAA.
| Year |
Top Box Office Film’s Gross Domestic Box Office / Adjusted¹ Gross Domestic Box Office
|
| 2005 |
Star Wars: Episode III–Revenge of the Sith
$380,262,555 |
| 2004 |
Shrek 2
$436,471,036 / $436,471,036 |
| 2003 |
Lord of the Rings: The Return of the King
$376,853,002 / $388,102,345 |
| 2002 |
Spider-Man
$403,706,375 / $431,500,273 |
| 2001 |
Harry Potter and the Sorcerer’s Stone
$317,557,891 / $348,415,989 |
| 2000 |
Dr. Seuss’ How the Grinch Stole Christmas
$260,031,035 / $299,590,487 |
| 1999 |
Star Wars Episode I–The Phantom Menace
$431,065,444 / $526,952,048 |
| 1998 |
Saving Private Ryan
$216,119,491 / $286,162,481 |
| 1997 |
Titanic
$600,743,440 / $812,770,536 |
| 1996 |
Independence Day
$306,169,255 / $430,160,876 |
| 1995 |
Toy Story
$191,773,049 / $273,772,559 |
| 1994 |
Forrest Gump
$329,168,011 / $489,027,116 |
| 1993 |
Jurassic Park
$356,748,415 / $535,122,622 |
| 1992 |
Aladdin
$217,042,825 / $324,779,745 |
| 1991 |
Terminator 2 Judgment Day
$203,347,436 / $299,949,543 |
| 1990 |
Home Alone
$281,493,907 / $413,257,012 |
| 1989 |
Batman
$250,713,403 / $392,173,862 |
| 1988 |
Rain Man
$171,188,895 / $258,657,673 |
| 1987 |
Three Men and a Baby
$167,780,960 / $266,475,642 |
| 1986 |
Top Gun
$176,650,237 / $295,686,784 |
| 1985 |
Back to the Future
$200,785,744 / $351,233,653 |
1Adjusted Gross Domestic Box Office figures are derived based on the total domestic gross of the film, divided by average ticket price in the year of release, multiplied by 2004 average ticket price ($6.21). Average annual ticket prices source: MPAA.


